2026 NFL Draft Set New Low for RBs
by Bo Marchionte
@bomarchionte | College2Pro.com
Published May 17, 2026, 6:49 PM
Something went unnoticed at the conclusion of Rounds 2 and 3 on draft night in Pittsburgh. A new record was set.
The lowest amount of drafted running backs came off the board between the first overall pick and pick 100, the final pick of the third round.
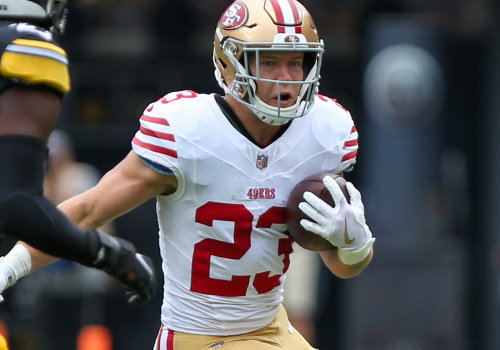
Jeremiyah Love, Jadarian Price and Kaelon Black were the only running backs drafted over the first two days of the NFL Draft. We know it’s a position diminishing some in terms of first round selections, but the lack backs drafted in the top three rounds shows the continued diminishment of the draft value.
I began going back and once I got past 2000, I knew that the value of the position only grew the further back we went. Low and behold it warped in going back to the 1970 NFL Merger and see the decline of the position that once was premiere spot.
Going from 1970 to 2026, the decades that evolved and how running backs once coveted are merely bystanders of day three.
Running Back Draft Capital: The Long Decline Since the 1970 Merger
1970–1979: The Workhorse Era
- Average of 13.2 running backs selected in the first three rounds per year.
- Average of 4.4 first-round running back per draft.
- Every draft featured at least 9 backs selected by the end of Round 3.
- The decade high was 18 in 1977.
- Running backs were the foundation of nearly every offense.
Year-by-Year Totals
- 1970 – 11 (5)
- 1971 – 15 (7)
- 1972 – 13 (3)
- 1973 – 11 (4)
- 1974 – 14 (6)
- 1975 – 9 (2)
- 1976 – 14 (6)
- 1977 – 18 (2)
- 1978 – 9 (3)
- 1979 – 16 (5)
The NFL of the 1970s revolved around bell-cow runners. Teams built their identities around durable backs capable of handling 20 to 30 touches every week. Offensive systems were rooted in power football, and organizations were willing to invest heavily to secure the next franchise runner.
The numbers are staggering by modern standards. More than 13 running backs were selected in the first three rounds each year, with over four coming off the board in Round 1. That meant nearly half the league was willing to spend premium draft capital on the position annually.
This decade set the gold standard for the running back’s value. If a team needed an offensive centerpiece, it found one in the backfield.
1980–1989: Still a Premium Position
Five Quick Hits
- Average of 10.3 running backs selected in the first three rounds.
- Average of 4.7 first-round running backs per year.
- Six drafts produced at least11 backs in the top three rounds.
- 1984 was the outlier with only 9 total and just 1 first-rounder.
- Teams still viewed elite runners as cornerstone players.
Year-by-Year Totals (1st RD)
- 1980 – 11 (5)
- 1981 – 13 (6)
- 1982 – 12 (7)
- 1983 – 9 (5)
- 1984 – 9 (1)
- 1985 – 7 (4)
- 1986 – 15 (6)
- 1987 – 14 (7)
- 1988 – 11 (5)
- 1989 – 11 (5)
The 1980s brought more sophisticated passing concepts, but the league still ran through the ground game. Franchise backs were viewed as transformational players capable of carrying offenses and shortening games.
Interestingly, the average number of first-round running backs actually increased compared to the 1970s. Nearly five runners per year were selected in Round 1, showing just how coveted the position remained.
Although the overall average dipped from 13.2 to 10.3, running backs were still among the safest and most celebrated investments on draft weekend.
1990–1999: The Beginning of the Slide
Five Quick Hits
- Average of 9.5 running backs selected in the first three rounds.
- Average of 3.2 first-round selections per draft.
- Four drafts featured 10 or more top-100 running backs.
- 1998 saw only 4 total backs, a dramatic drop.
- Teams were becoming more selective with premium investments.
Year-by-Year Totals (1st RD)
- 1990 – 13 (6)
- 1991 – 10 (3)
- 1992 – 6 (3)
- 1993 – 9 (3)
- 1994 – 15 (3)
- 1995 – 13 (5)
- 1996 – 12 (3)
- 1997 – 10 (2)
- 1998 – 4 (2)
- 1999 – 11 (2)
The 1990s marked a turning point. Running backs remained highly valued, but the league began spreading its resources more evenly. Quarterbacks play and passing efficiency were becoming increasingly important.
The average total slipped below 10 for the first time, while first-round selections dropped from 4.7 in the 1980s to 3.2. The sharp decline in 1998 hinted at what was coming.
The position was still essential, but front offices were no longer treating running backs as automatic premium investments.
2000–2009: The Position Loses Ground
Five Quick Hits
- Average of 7.8 running backs were selected in the first three rounds.
- Average of 2.7 first-round selections per year.
- 2000 and 2001 were the last drafts with double-digit totals.
- 2007 featured just 2 top-three-round running backs.
- The committee backfield began reshaping roster construction.
Year-by-Year Totals (1st RD)
- 2000 – 9 (5)
- 2001 – 10 (3)
- 2002 – 8 (2)
- 2003 – 6 (2)
- 2004 – 6 (2)
- 2005 – 9 (3)
- 2006 – 8 (4)
- 2007 – 9 (2)
- 2008 – 11 (5)
- 2009 – 6 (3)
The 2000s were a transition period. Teams still drafted star runners, but the position was no longer insulated from broader philosophical changes.
Passing efficiency, salary-cap management and shorter running back career arcs forced front offices to rethink the value proposition. The average fell to 7.8 per year, down sharply from 9.5 in the 1990s.
The message was becoming clear: production could be found outside the top of the draft, and many clubs were no longer willing to pay a premium for it.
2011–2019: The Devaluation Accelerates
Five Quick Hits
- Average of 7.0 running backs selected in the first three rounds.
- Average of 1.6 first-round selections per draft.
- 2016 produced only 4 total backs.
- Several drafts featured zero first-round running backs.
- Analytics and roster economics transformed the position.
Year-by-Year Totals (1st RD)
- 2010 – 7 (3)
- 2011 – 8 (1)
- 2012 – 7 (3)
- 2013 – 6 (0)
- 2014 – 8 (0)
- 2015 – 8 (2)
- 2016 – 4 (1)
- 2017 – 8 (2)
- 2018 – 8 (3)
- 2019 – 7 (1)
By the 2010s, the running back market had fundamentally changed. Teams were increasingly reluctant to use first-round picks on a position with a short shelf life and a steady pipeline of Day 2 and Day 3 contributors.
The average number of first-round selections collapsed to just 1.6 per year. In both 2013 and 2014, no running backs were chosen in Round 1.
The position remained important, but the investment strategy had shifted dramatically.
2020–2026: Historic Low Point
Five Quick Hits
- Average of 5.6 running backs selected in the first three rounds.
- Average of 1.0 first-round running back per draft.
- Three drafts (2022, 2024 and 2026) had zero or minimal early-round volume.
- 2024 produced only 4 top-100 backs.
- 2026 set the merger-era low with just 3, despite 2 first-round selections.
Year-by-Year Totals (1st RD)
- 2020 – 9 (1)
- 2021 – 4 (2)
- 2022 – 6 (0)
- 2023 – 7 (2)
- 2024 – 4 (0)
- 2025 – 6 (2)
- 2026 – 3 (2)
The current decade has pushed running back devaluation to its most extreme point. Teams continue to acknowledge elite talent, but the overall appetite to invest early-round capital has evaporated.
The 2026 draft made history. Only three running backs were selected in the first three rounds, the lowest total since the 1970 merger. Remarkably, two came in the first round, meaning after those marquee selections the position nearly disappeared.
The contrast is stunning. In the 1970s, teams averaged 13.2 top-three-round backs. In the 2020s, that number has fallen to 5.6. The running back remains vital on Sundays, but on draft weekend, he has never been more difficult to value.
Running Backs in Rounds 2 and 3: The Quiet Collapse of a Featured Position
Decade Averages (Rounds 2 and 3 Only)
- Decade Round 2 Avg.| Round 3 Avg. | Combined Avg.
- 1970s 1 3.8 7.9
- 1980s 1 2.9 6.0
- 1990s 5 3.9 7.4
- 2000s 1 2.9 5.0
- 2010s 8 2.7 5.5
- 2020–26 0 2.3 4.3
Five Quick Takeaways
- The 1970s and 1990s were the golden eras, averaging nearly eight running backs selected in Rounds 2 and 3 each year.
- The 1990s produced the biggest single-year explosion, with 13 backs drafted in Rounds 2 and 3 in 1994.
- The 2000s marked a dramatic shift, dropping to just five backs per year on average.
- The modern game has further reduced demand, with only 4.3 backs per year selected in Rounds 2 and 3 since 2020.
- The 2026 NFL Draft reached rock bottom, producing only one running back in Rounds 2 and 3 combined.
Historical Perspective
The first round may receive all the attention but Rounds 2 and 3 once served as the true feeding grounds for NFL running backs.
These were the rounds where future stars were routinely discovered. Teams still valued the position highly but could wait just long enough to scoop up feature runners capable of carrying 300 touches per season. In many draft rooms, if a club emerged from Day 2 without a running back, it felt as though an essential piece of the offense had been left behind.
The numbers tell the story.
During the 1970s, nearly eight running backs per year came off the board in Rounds 2 and 3. The 1990s mirrored that pace, reaffirming the position’s importance in an era dominated by workhorse backs.
Then the slide began.
The 2000s dropped to five per year. The 2010s remained slightly above that mark, but the decline accelerated in the current decade. Since 2020, teams have averaged just 4.3 running backs in Rounds 2 and 3.
The 2026 draft brought the trend to its most extreme point.
No running backs were selected in Round 2. Only one was chosen in Round 3.
A position once considered the heartbeat of every offense has become one of the most replaceable commodities in football.
Photo Credit Frank Hyatt/College2Pro.com